Big vs. Small
“Big Data” has taken the spotlight in the past decade, particularly because corporations have used it extensively to understand and predict consumer behavior. Companies collect hundreds of data points on consumers including basic information like age, date of birth, and sex and more detailed information like recent purchases, advertisements clicked on, etc. These data points help companies form profiles of potential customers so that they can customize their advertisements in order to enhance their effectiveness. While there is no official threshold for how big a dataset has to be to be considered “big data,” the datasets are generally large enough to require sophisticated software to manage.
As educators begin discussing how to create a culture of data to inform school decision-making, big data has inevitably made an appearance in this dialogue. In the context of education, big data can be anything from the collection of massive amounts of highly academic, cutting edge data such as student facial expressions during a lecture, to more traditional items like the scores of standardized assessments at the district level. When we discuss big data in this post, we are referring to the latter.
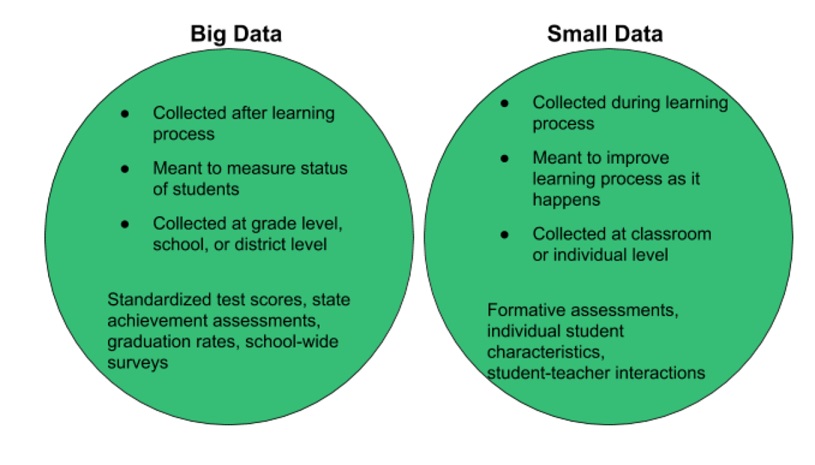
What distinguishes big data from small data in education is that big data produces measurements about schools and students after the learning process has taken place. These results can inform school leaders of broad areas where extra support might be needed; however, this information is often incapable of telling school leaders of exactly what is happening during the learning process and how to change it in order to improve the results appearing in the big data.
Small data, on the other hand, is data meant to be collected alongside the learning process. In other words, it is data that is distinctively used to enhance student learning as opposed to simply measuring it. This data is generally analyzed on a much smaller scale: classes of students instead of grade levels, schools, or districts. It is generally collected by teachers using formative assessments, the smaller in-process quizzes and tests normally given after the completion of a unit or chapter.
Such a small scope allows those interacting with the students to understand students better rather than turning students into statistics. Some examples of small data are the scores of formative assessments, students’ confidence levels when answering a question, the time it takes to complete an assignment, etc.
“The elimination of statistical tools in data-based decision-making helps level the playing field between schools with lots of resources and schools that need such information but don’t have the resources to get it.”
Leveling the playing field
Small data avoids many of the issues that schools encounter when they only focus on big data. Schools’ efforts to collect and utilize big data may be obstructed by a lack of sophisticated statistical software and other resources. Every aspect of collecting big data requires statistical software; when a school decides what data they need, they need to make sure that the instruments they use to collect that data are valid and reliable. Paradoxically, determining the validity and reliability of data instruments usually requires complicated statistical coefficients.
Even if a school could collect the data without any problems, deriving meaning from the results often requires the ability to break results down into groups of students, which may not be possible without such software. Worse yet, as educational columnist Berlin Fang and school psychologist Jennifer Shewmaker point out in “The Case for Small Data in Higher Education,” it is the schools “who could benefit the most from such data” that often lack the resources to collect or analyze it.
Although Fang and Shewmaker are referring to colleges and universities, it is no secret in the American education system that the schools that need the most support are often punished with budget cuts. Thus, establishing a culture of data for the schools who most desperately need new ways to understand the progress of their students is at best intimidating, and at worst, impossible.
Small data, however, does not require fancy software, as it is collected and used at the classroom level by teachers themselves. Thus, instead of a district-level data analytics department analyzing hundreds or thousands of students, teachers analyze 20 to 30 students whom they interact with daily.
The small scale of the data collection renders the use of statistical software unnecessary and affords teachers the ability to interpret and utilize the results themselves. This autonomy makes sense since teachers are ultimately the ones responsible for how students learn the material. The elimination of statistical tools in data-based decision-making helps level the playing field between schools with lots of resources and schools that need such information but don’t have the resources to get it.
Data without numbers
Increased equality is not the only advantage of small data. Assessments given in the middle of the learning process let teachers adjust their lesson plans based on class strengths and weaknesses. Evidence from the National Council of Teaching Mathematics evinces that formative assessments within and between lessons (called short-cycle assessments) and within and between instructional units (called medium-cycle assessments) improve student achievement. NCTM also found that teachers “reported greater professional satisfaction and increased student engagement in learning” in classrooms where those assessments were used.
One reason formative assessment is so effective is that it provides room for qualitative feedback in a way that standardized tests do not. Qualitative feedback is received both by students and by teachers, who can explain to students how to better understand the material. Students not only receive a score back but also actually have the ability to discuss with their teacher what went wrong and how to improve. Marco Learning aims to make this process even more efficient by allotting teachers’ resources away from grading and data collection so that they can instead spend their time interpreting the data and using it to adjust their lesson plans.
When grading an assignment, Graders always provide qualitative feedback on the individual and classroom level. Moreover, when a teacher receives the results of an assignment, they also receive a statistical summary sheet. This sheet includes information about the highest and lowest scoring students, a summary of class strengths and weaknesses, and a breakdown of the scores by each rubric component.
Such a breakdown allows teachers to easily see which parts of a concept students are struggling with. For example, if a teacher submits an essay assignment for an AP US History class, the statistical summary might indicate that students have mastered thesis-writing, but they haven’t succeeded yet at including context from broader historical periods. The qualitative data works to explain the snapshot that the quantitative data captures.
The strictly quantitative nature of big data can limit school leaders’ understanding of what is creating the big data results. Pasi Sahlberg, a renowned authority on the use of small data in schools, writes in an interview with the Huffington Post that solely focusing on big data “undermines the complexities of teaching and learning in schools.”
Big data is great at answering the question of which students need extra support; however, it’s too broad to give any indication of how those students can be best helped. Sahlberg says “Small data can help teachers to understand why some students don’t learn as well as they could… better than big data that most often show whether students learn or not what they are supposed to learn.” Identifying struggling students is only half the battle. Much more crucial to providing effective support is determining why those students are struggling, and the answer to that question requires knowledge about the student beyond a score—something that big data simply can’t offer.
Sometimes the answer to why a student is struggling isn’t academic, and no assessment, standardized or formative, will indicate what is going on. But small data is flexible enough to capture more than a student’s academic standing. The personal relationships teachers share can also produce small data, which may identify more accurately what support individual students need. Fang and Shewmaker give an example of this phenomenon: the creation of a student support program at Abilene Christian University called SOAR (Student Opportunities, Advocacy and Resources). When teachers, academic advisors, coaches, or other staff “suspect that a student may be at-risk for potential problems, they can send alerts to the SOAR program, which then recommends interventions.” Possible reasons for alerts include poor academic performance or attendance, physical or mental health issues, problems at home, or talk about dropping out.
It’s not difficult to see how this program could apply to K-12 schools. Indeed, teachers in K-12 education often play a larger role in the lives of students than those at the university level; it is often obvious to a teacher when there is a sudden shift in behavior or performance. Collecting such data allows the school to intervene and create a support network for that student, which could make a significant difference in the student’s life and transform their relationship with their educators.
“Keeping students involved in their learning process makes them more invested in their improvements, as the continuity between assignments allows them to bear witness to and get excited about their own progress.”
Investing in students so they invest in themselves
Part of this relationship transformation is an inherent advantage of small data, as students are no longer reduced to statistics or test scores. Small data allows teachers and other school leaders to recognize students as individuals with individual strengths, weaknesses, needs, and lives. It also allows students to have more agency in their education, further fostering the individualization of the learning process. Marco Learning takes particular interest in encouraging such individualization. As discussed earlier, every student receives qualitative feedback tailored to their work, explaining what they mastered and what still needs work, as well as how to improve those weaknesses.
One teacher had students note their strengths and weaknesses from a previous assignment and aggregated this data for the Grader to use when grading the next assignment. This data allowed the Grader to evaluate each student’s progress and provide an update to the student in the qualitative feedback section, congratulating them on mastering old weaknesses and explaining how to further improve. Keeping students involved in their learning process makes them more invested in their improvements, as the continuity between assignments allows them to bear witness to and get excited about their own progress.
Qualitative feedback is only one tool to create this continuity. Jo Besford, the director of an education social enterprise that helps establish cultures of data in schools, argues that immediate feedback, such as a student receiving the results to an online test as soon as they submit it, also keeps students engaged. She writes in the WISE Initiative article “Bigger Isn’t Necessarily Better – the Impact of Small Data in Education” that, “Learners are so much more engaged with their score when they receive it while they can still remember what they answered, or even more importantly remember why they answered like that.” She claims that this engagement even extends to groups of students who are traditionally apathetic toward their education.
Beyond its ability to provide continuity between assignments, small data is conducive to student engagement because even the data collection process may involve the students. According to an article produced by The Hechinger Report, teachers at Marley Park Elementary School “use a student data collection system the school calls ‘All Time Best,’ which is designed to track students’ progress toward meeting state learning standards in math and English.” The data is collected through students “raising their hands if they got the question right and then graphing their results in their notebooks.” Another teacher in the district teaches her students how to use Google Sheets to track their progress toward state initiatives.
Similar to the example of students noting their own strengths and weaknesses, small data is helping students rely less on teachers to understand their own learning goals and how they might achieve them. Obviously, the responsibility of giving students the tools to achieve these goals falls on the teachers, but students are no longer being led blindly through the process.
Although big data may seem more official, it’s important for educators to recognize that the results seen in standardized tests, school-wide student surveys, and other summative instruments start in the classroom. To change those results, the classroom itself must change. The ease with which teachers can integrate small data into their day-to-day operations, combined with small data’s capacity to transform the role students play in their own education, makes it an accessible and powerful tool in the establishment of a culture of data in schools.
If you are interested in learning about how Marco Learning can make your use of small data even more powerful and efficient, contact us.